Plot annotation elements within genomic region
plot_dna_objects(
  regulondb,
  genome = "eschColi_K12",
  grange = GRanges("chr", IRanges(1, 5000)),
  elements = "gene"
)
Arguments
- regulondb
A
regulondb()object.- genome
A valid UCSC genome name.
- grange
A
GenomicRanges::GRanges-class()object indicating position left and right.- elements
A character vector specifying which annotation elements to plot. It can be any from:
"-10 promoter box","-35 promoter box","gene","promoter","Regulatory Interaction","sRNA interaction", or"terminator".
Value
A plot with genomic elements found within a genome region, including genes and regulators.
Examples
## Connect to the RegulonDB database if necessary
if (!exists("regulondb_conn")) {
regulondb_conn <- connect_database()
}
## Build the regulondb object
e_coli_regulondb <-
regulondb(
database_conn = regulondb_conn,
organism = "chr",
database_version = "1",
genome_version = "1"
)
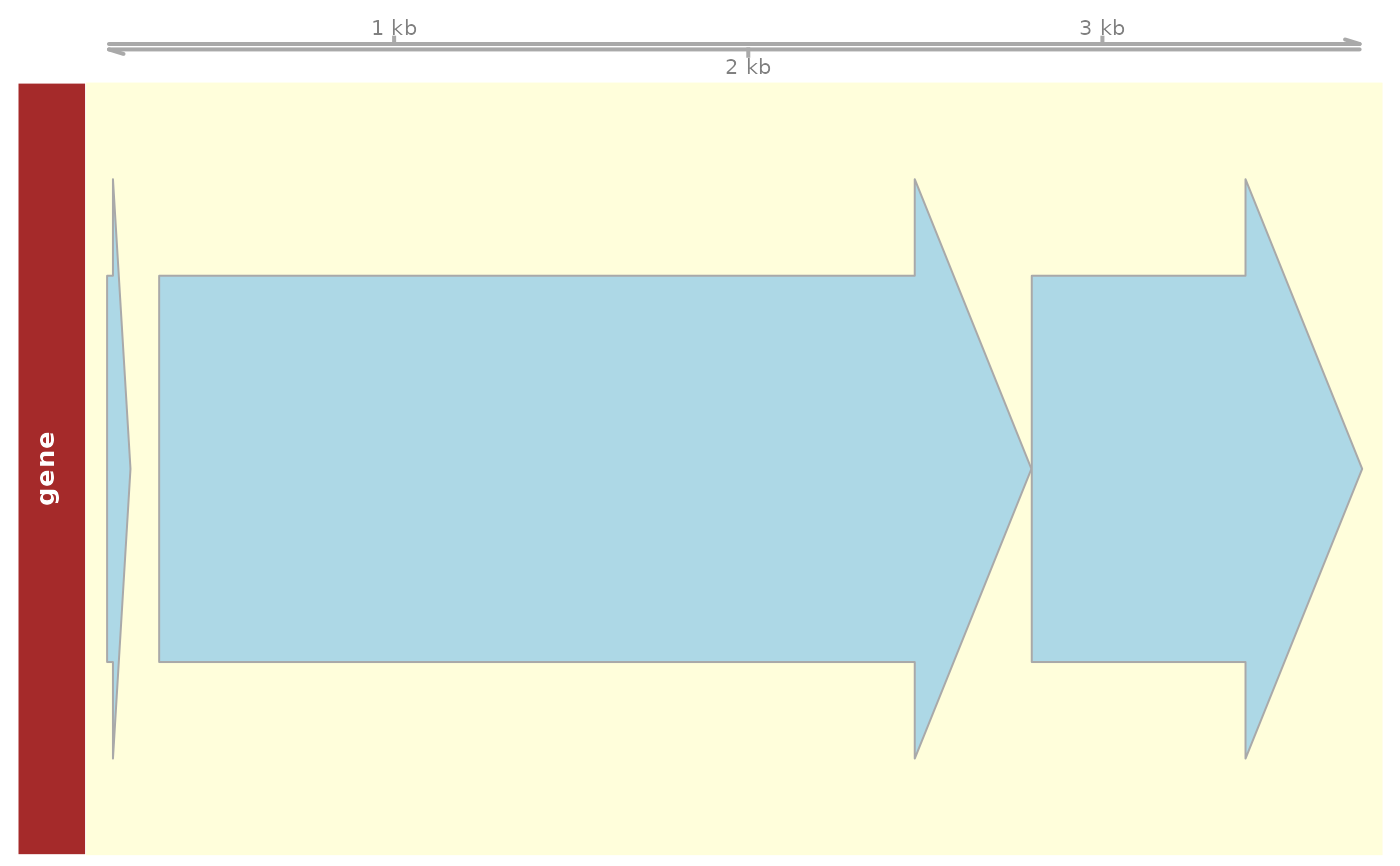
## Plot some genes from E. coli using default parameters
plot_dna_objects(e_coli_regulondb)
 ## Plot genes providing Genomic Ranges
grange <- GenomicRanges::GRanges(
"chr",
IRanges::IRanges(5000, 10000)
)
plot_dna_objects(e_coli_regulondb, grange)
## Plot genes providing Genomic Ranges
grange <- GenomicRanges::GRanges(
"chr",
IRanges::IRanges(5000, 10000)
)
plot_dna_objects(e_coli_regulondb, grange)
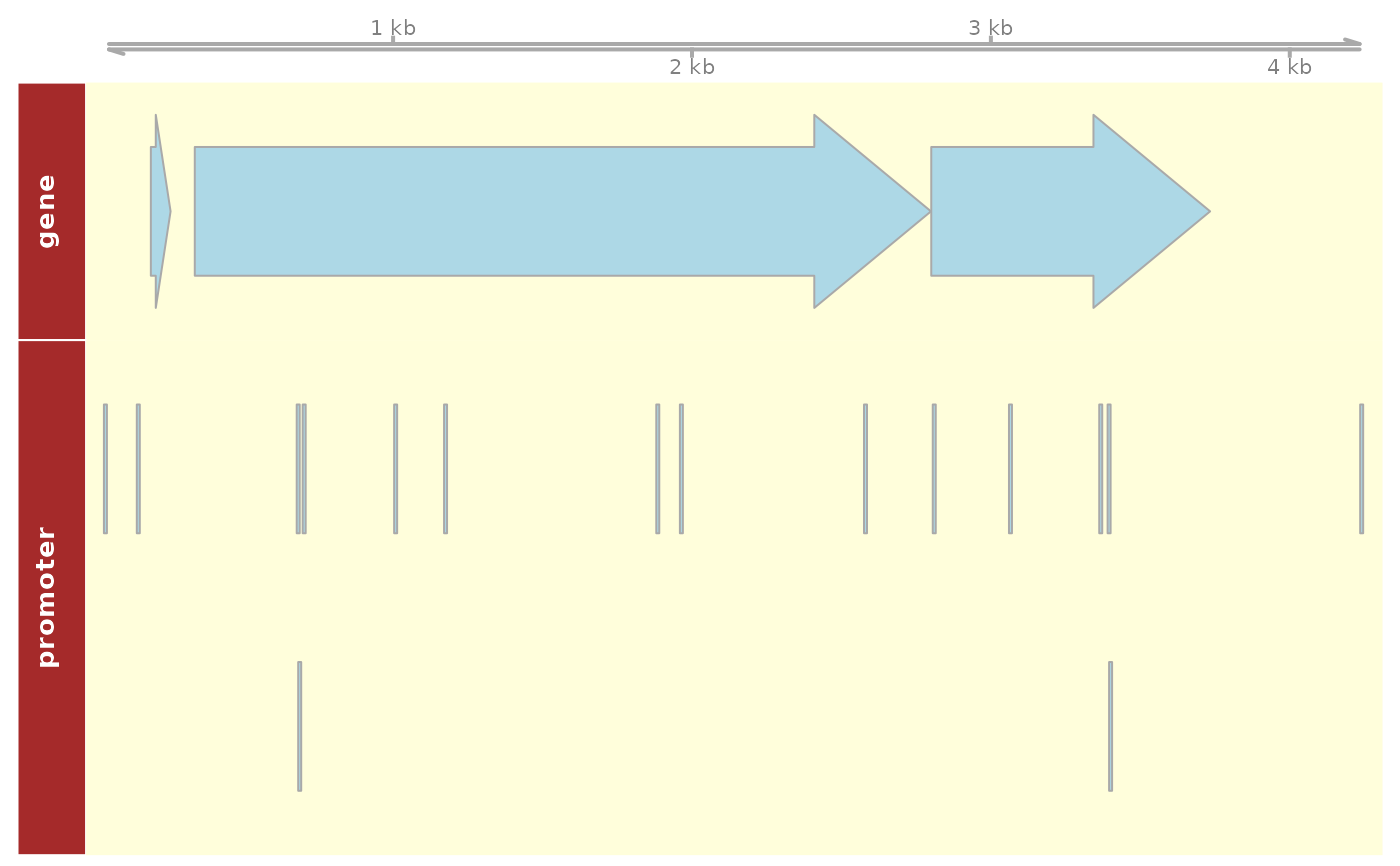
 ## Plot aditional elements within genomic positions
plot_dna_objects(e_coli_regulondb,
grange,
elements = c("gene", "promoter")
)
## Plot aditional elements within genomic positions
plot_dna_objects(e_coli_regulondb,
grange,
elements = c("gene", "promoter")
)